Citi-Bike Data Analysis with Python
2016年11月14日 Monday, 发表于 纽约
如果你对本文有任何的建议或者疑问, 可以在 这里给我提 Issues, 谢谢! :)
In my previous blog post Shell Programming, I give an example to illustrate how to use Shell to get data from the Internet and then do some simple data analysis. Nowadays, as Python which is a high level dynamic programming language is widely used in Data Science. I am also interested in it and want to use Python to deal with the data in Shell Programming.
Also, I want to introduce two communication tools which is helpful to organize your thoughts and identify your key points. Show how to clearly tell your audience why you did it and what you have done. This is very important when you finish a project and is going to give a presentation.
OVERVIEW
- Python Basic
- Communication Tool: Message Box and Story Arc
- Simple Project: Citi-Bike Data Analysis
- Reference
1.Python Basic
1.1 Python Shell
To write a “hello.py” script is the same as the Shell Script, use
1 | nano hello.py |
There are mainly two widely used “major” versions of Python: Python2 and Python3. The default version is Python2. You can simply type “python” in your terminal to check the version of your python.
Python2 and Python3 have a little difference in some place. For example,
1 2 | print("Hello World")
print "Hello World"
|
are both correct in python2 but only the first one is correct in python3.
After we have writen our python script “hello.py”, we can execute it use one of the following code:
1 2 3 | python hello.py python2 hello.py python3 hello.py |
As we have learned previously, if we want to be able to execute a script without having to specify the interpreter with which to execute it, we need to
- add a shebang at the top of the file specifiying which interpreter to use to run it,like “#!/usr/bin/env python” -make the script executable, use “chmod a+x hello.py”
Then we can run it use:
1 | ./hello.py |
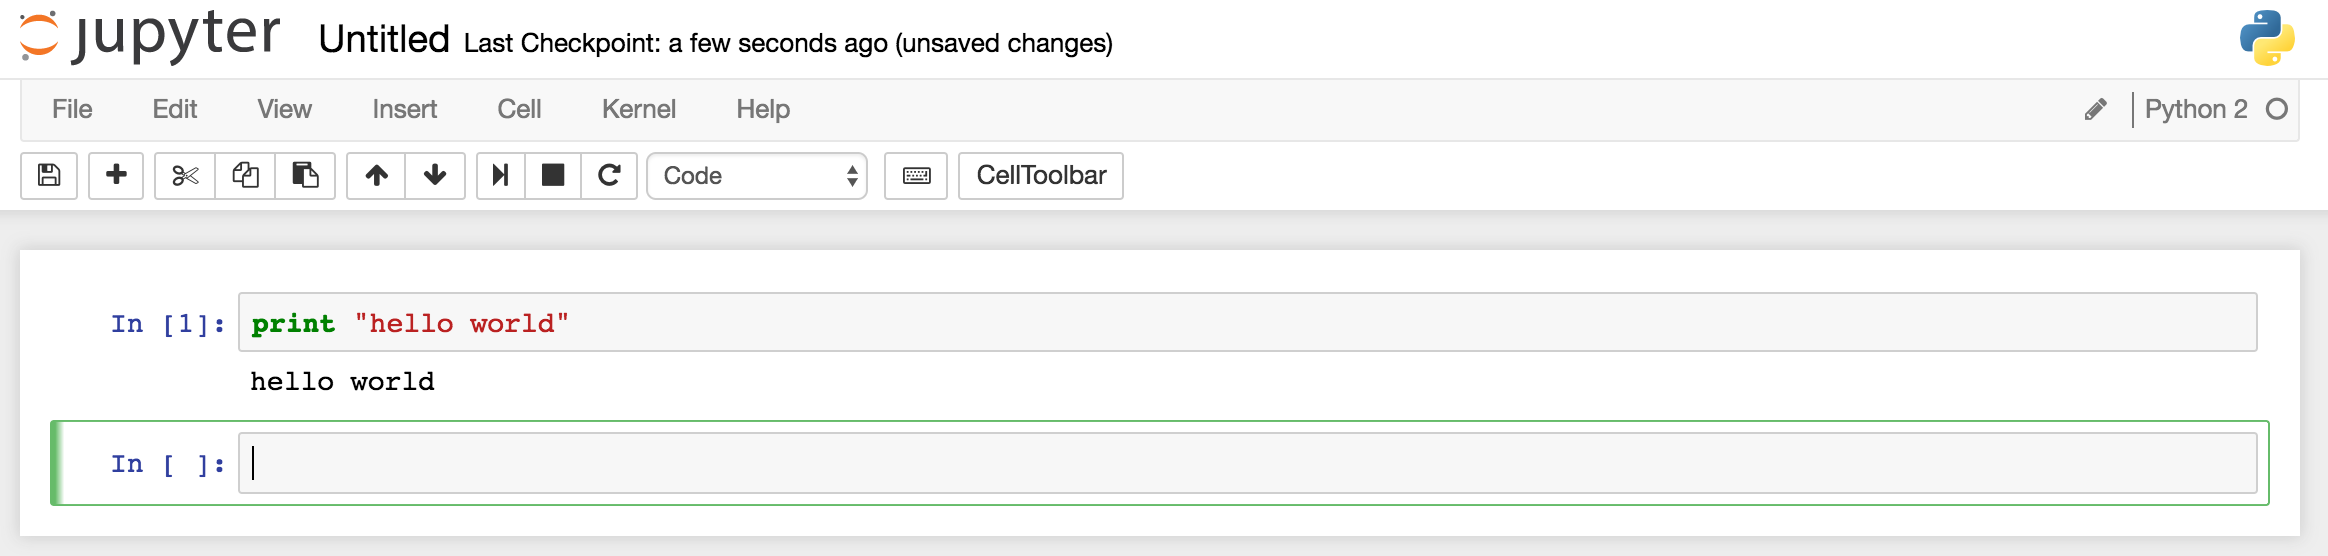
1.2 Jupyter Notebook
Another popular way to use python is with Jupyter Notebook. It allows you to write code and see the result from a web browser. Just type:
1 | jupyter notebook |
in your terminal, then the browser will automatically open the jupyter notebook. You can set your default browser when you install the jupyter notebook.
1.3 Lists/arrays
We can create an empty list and then add content to it, like this:
1 2 3 4 5 | animals=[]
animals.append("dog")
animals.append("cat")
print(animals)
|
or we can directly create a list with items already in it, like this:
1 2 | animals=["dog", "cat"] print(animals) |
We can access individual list entries by index(start from 0, different from Matlab), also we can iterate over all the entries in a list:
1 2 3 4 | print (animals[0]) for animal in animals: print(animal) |
We can remove the last item:
1 2 3 | a = animals.pop() print(a) print(animals) |
a is the last tiem, and the new animals didn’t contain the last item.
Also we can remove a specified item by index:
1 2 3 | a = animals.pop(1) print(a) print(animals) |
to remove the first item.
To count the number of a specified tiem, use
1 | animals.count("cat") #count the number of cat in the list
|
To sort the original list
1 2 | animals.sort() print(animals) |
Python has a concept called “list comprehension” that we can use to create lists from other lists in a very natural way. We can create a new list of non-cat animals:
1 2 3 4 | animals=["dog", "cat", "cat", "monkey", "bear"] new = [a for a in animals if a!="cat"] print(new) |
we can also perform an operation on the selected elements at the same time, for example:
1 2 | new = [a.upper() for a in animals if a!="cat"] print(new) |
This will give a capitalized list without “cat”. Another example: from a list of numbers, create a list of only the even numbers:
1 2 3 | l=[1, 2, 3, 4, 4, 5, 7, 8] e = [a for a in l if a%2==0] |
1.4 Read in Data from a CSV file
First we need to import CSV module:
1 2 3 4 5 6 7 | import csv
filename="201601-citibike-tripdata.csv"
with open(filename,'r') as csvfile:
filereader=csv.reader(csvfile,delimiter=',')
for row in filereader:
print(', '.join(row))
|
Each row of the csv file is read in as an array of string. If you are only interested in the second column, you can just change the last line of the code:
1 | print(row[1]) |
Remember the start index is 0, so the second column is row[1].
Also we need to separately read in the header row, remember the first row is the title:
1 2 3 4 5 6 7 8 9 10 | import csv filename="201601-citibike-tripdata.csv" with open(filename,'r') as csvfile: filereader=csv.reader(csvfile,delimiter=',') header = next(filereader) for row in filereader: print(row[1]) print(header) |
If you want to read in the trip duration as an integer value and store all of the durations in a list:
1 2 3 4 5 6 7 8 9 10 | durations=[] filename="201601-citibike-tripdata.csv" with open(filename,'r') as csvfile: filereader=csv.reader(csvfile,delimiter=',') header = next(filereader) for row in filereader: durations.append(int(row[0]))#convert str to int print(durations) |
1.5 Using pands
Using csv module sometimes is elaborate. Pandas is a popular library for working with data. To read in data from a csv file:
1 2 3 4 5 6 | import pandas as pd filename="201601-citibike-tripdata.csv" df=pd.read_csv(filename,sep=',') print(df) |
If you want to see the column names:
1 | df.column |
the top few rows or the bottom few rows:
1 2 | df.head() df.tail() |
Or to specify the number of rows to see:
1 2 | df.head(3) df.tail(5) |
You can see a quick statistic summary of the numeric fields in your data:
1 | df.describe() |
To iterate over rows of a pandas data frame, we use “iterrows()”
1 2 | for index, row in df.iterrows(): print(index,row['starttime']) |
2.Communication Tool: Message Box and Story Arc
2.1 Message Box
The message box is a tool to help you organize your thoughts and identify key points. It is designed to be flexible. it can be used to help structure a presentation, organize a lecture, outline a proposal or prepare for an interview. It looks like this:
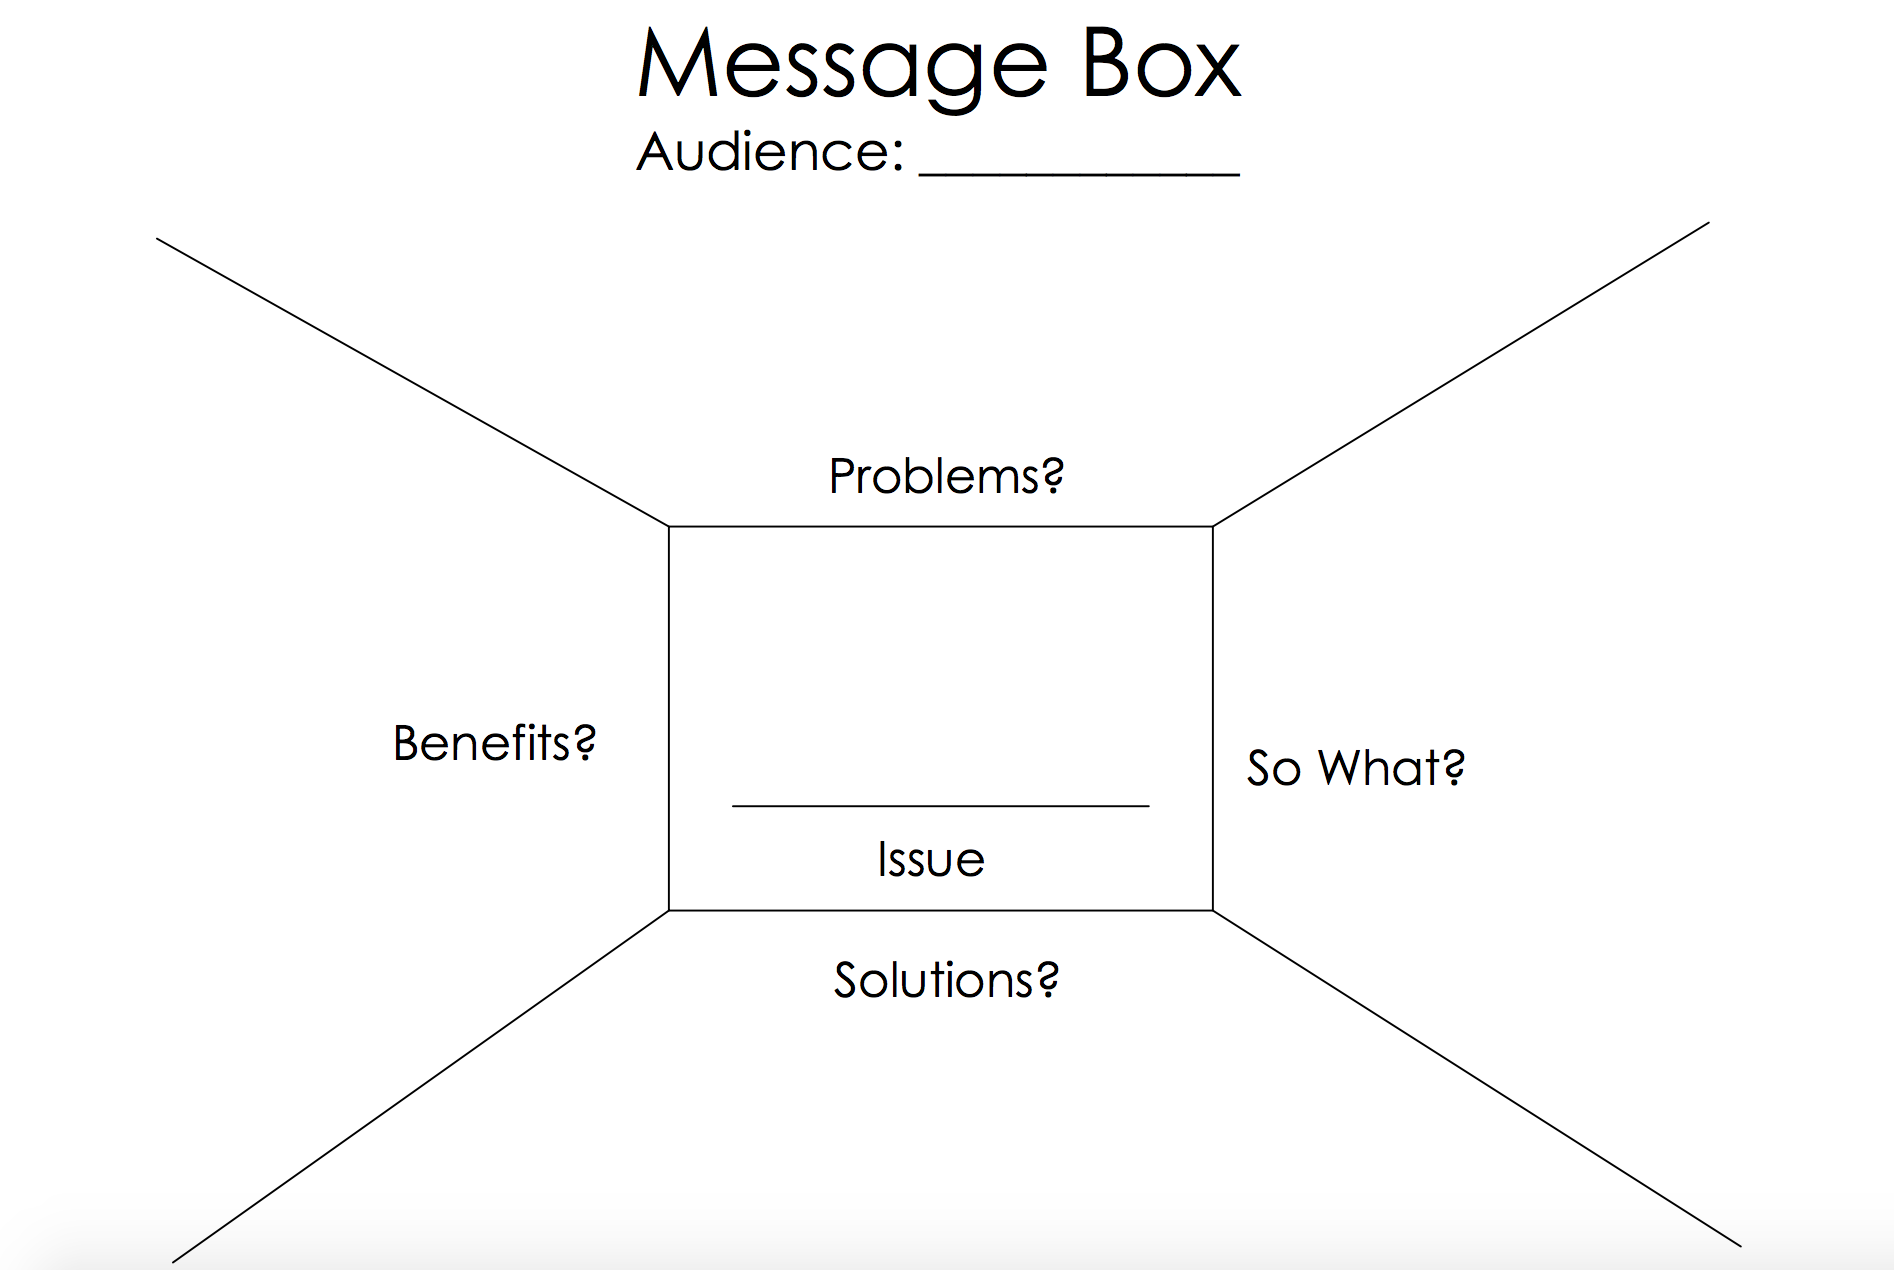
First, you need to specifiy you audience, such as the company, the students or the journalists. Always remember that your goal as an effective communicator is to identify the information that is critical to your audience: what really matters to them and what do they really want to know.
Then,you need to streamline your information into concise messages by answering the following questions:
- what are the problems?(problems?)
- why does this information matter to my listener?(so what?)
- what are some of the possible solutions to this problem?(solutions?)
- what are the potential benefits of solving this problem?(benefits?)
Pare down your ideas so that each message is one or two concise sentences. Once you have finished this box, you can add more anecdotes and facts to reinforce your message.
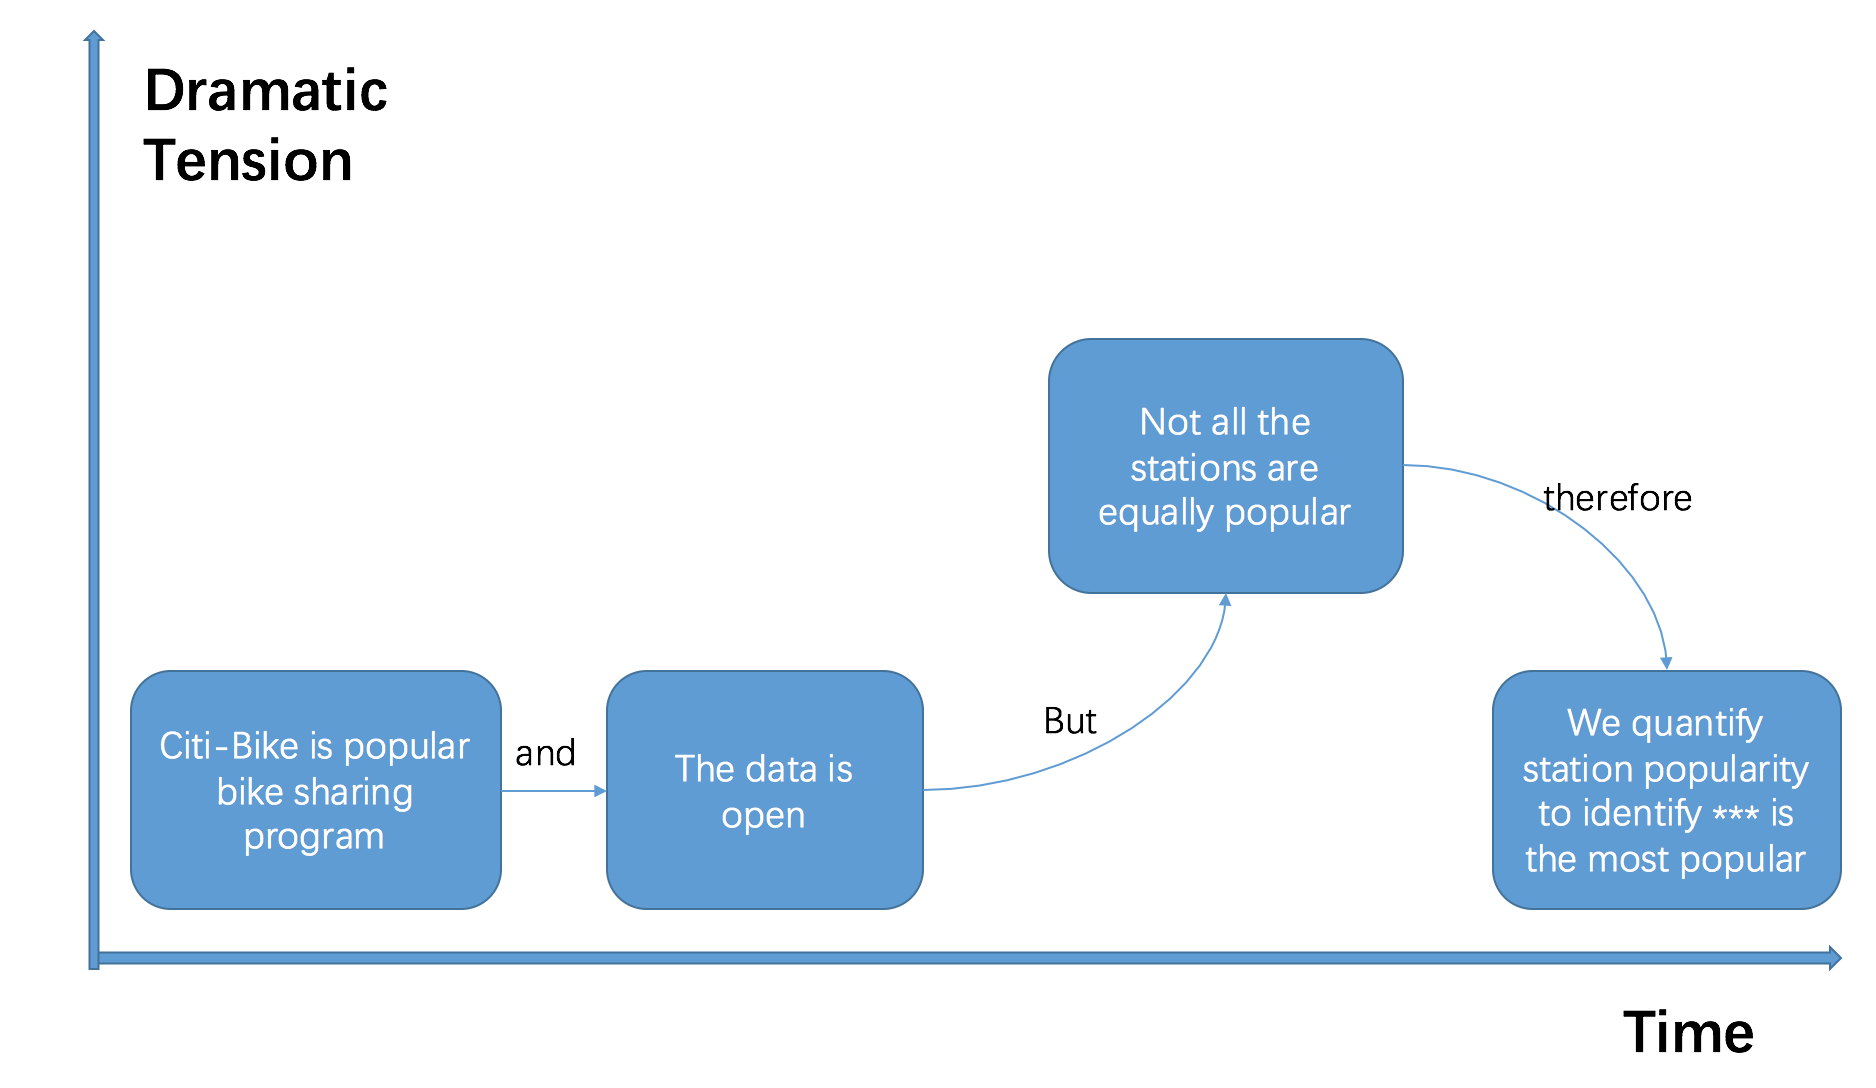
2.2 Story Arc
There is another tool called story arc to describe our project when we give a presentation. Yes, it is widely used in television, comic book and films. We are actully telling a story when we want to give a great presentation. Take our Citi-bike project as an example:
3.Simple Project: Citi-Bike Data Analysis
The previous parts are the preparation of this simple project. Then we can use the Message Box tool to construct our streamline and python programming to get what we want. All my code can be found in my GitHub webpage. More details also can be found in my previous posts Shell Programming.
3.1 The most popular station
This is an analysis of the Citi Bike bike sharing program, which operaties in New York City. Of all the Citi Bike stations, we want to know which is the most popular, so that we can focus our attention on that station for further data analysis. Using open data, we count the number of times that each station appears as either a start station or end station on a trip, and we identify the most popular station as Pershing Square North, with 12,810 entries in January 2016, and so we can focus on this station for further analysis.
3.2 The most popular hour of the day to start a trip.
The result is reasonable showing as below:
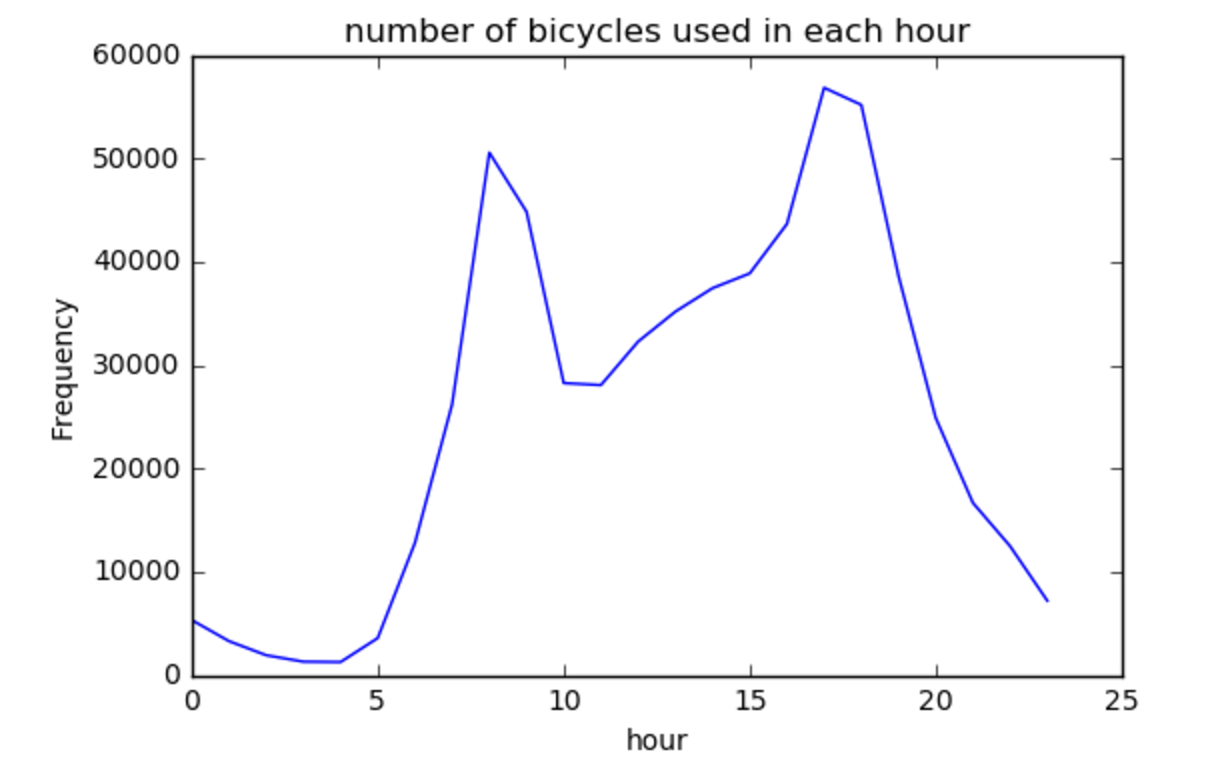
In the morning at 7:00am–9:00pm, people go to work by bike. In the afternoon at 16:00pm–18:00pm, people go home by bike. Our audience might be the Citi–Bike company. This result can help them to arrange the compulsory bicycle inspection. Avoid the rush hour of bicycle using.
4.Reference
- ALDO LEOPOLD LEADERSHIP PROGRAM, Stanford University
- Wikipedia
- Scientific Computing Workshop from NYU Tandon Department of ECE