SAMIAM Introduction
2016年07月28日 Thursday, 发表于 纽约
如果你对本文有任何的建议或者疑问, 可以在 这里给我提 Issues, 谢谢! :)
Recently I am interested in Probabilistic Grephfical Model(PGM). There is no related course in our school and I have to learn it by myself. Luckily I find some textbooks and online courses about PGM. The most important thing in PGM is Networks such as Bayes Network and Markov Network. So a network visualization software like SAMIAM is important for us to analyse our model intuitively.
OVERVIEW
- SAMIAM Installation
- A Simple example: Credit-worthiness Evaluation
- Reference
1. SAMIAM Installation
SAMIAM was developed by the Automated Reasoning Group at UCLA to provide a graphical interface for manipulating probabilistic networks on Windows, Linux, or Mac OS. You can download it from here:
Because SAMIAM relies on Java and needs both the Java Runtime Environment (JRE) and the Java Development Kit (JDK), we also need to download them:
JRE:http://java.com/en/download/manual.jsp JDK:http://www.oracle.com/technetwork/java/javase/downloads/index-jsp-138363.html#javasejdk
After installation, we can use it to construct our graph model. First, select Edit Mode in Mode menu. Then we can change the Conditional Probability Distribution(CPD) of nodes and Add Edge.
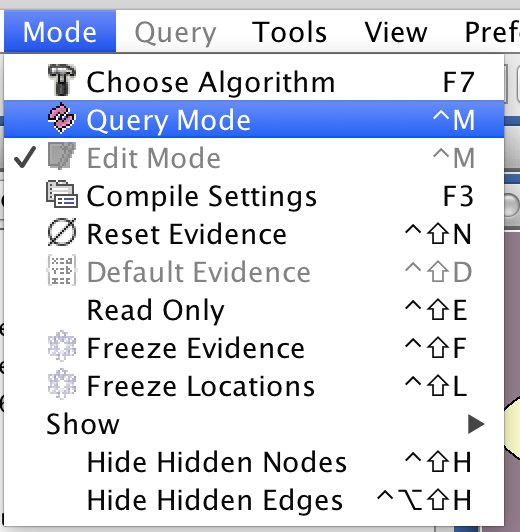
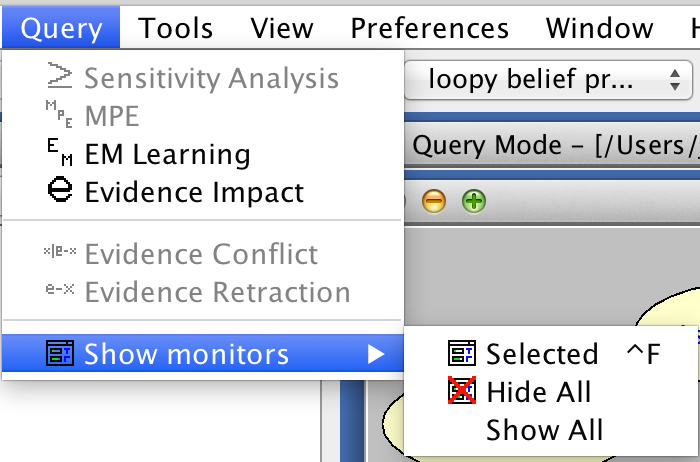
Also we can choose Query Mode in Mode menu to monitor the marginals of nodes. In Query menu, Select Show All in Show monitors.See the following figure.
2. A Simple example: Credit-worthiness Evaluation
Now you need to develop a predictor of credit-worthiness. This predictor can tell people whether a person will make timely payments on his credit card bills.
The bank is able to observe a customer’s income, the amount of assets the person has, the person’s ratio of debts to income, the person’s payment history, as well as the person’s age. Also we know the credit-worthiness of a person is ultimately dependent on how reliable a person is, the person’s future income, as well as the person’s ratio of debts to income. There are totally 8 nodes in this network.
Then we need to specify the relationship of these nodes. In practice,we need to using a lot of data to train the best inference between these nodes Here, we just use our common sense to give a brief relationship and establish a simple model. For example, if the person has a bad payment history, there will be a high probability that he is not reliable. The following network is what I create, you might not be able to establish a exactly same network. But you should satisfy:
P(R = Reliable H = Excellent) > P(R = Reliable | H = Acceptable) > P(R = Reliable | H = Unacceptable).
Here, H denotes “history”. The following figure is setting H=excellent and H=unacceptable, we can find :
P( Credit-worthness = Positive | H = Excellent)= 74.65%
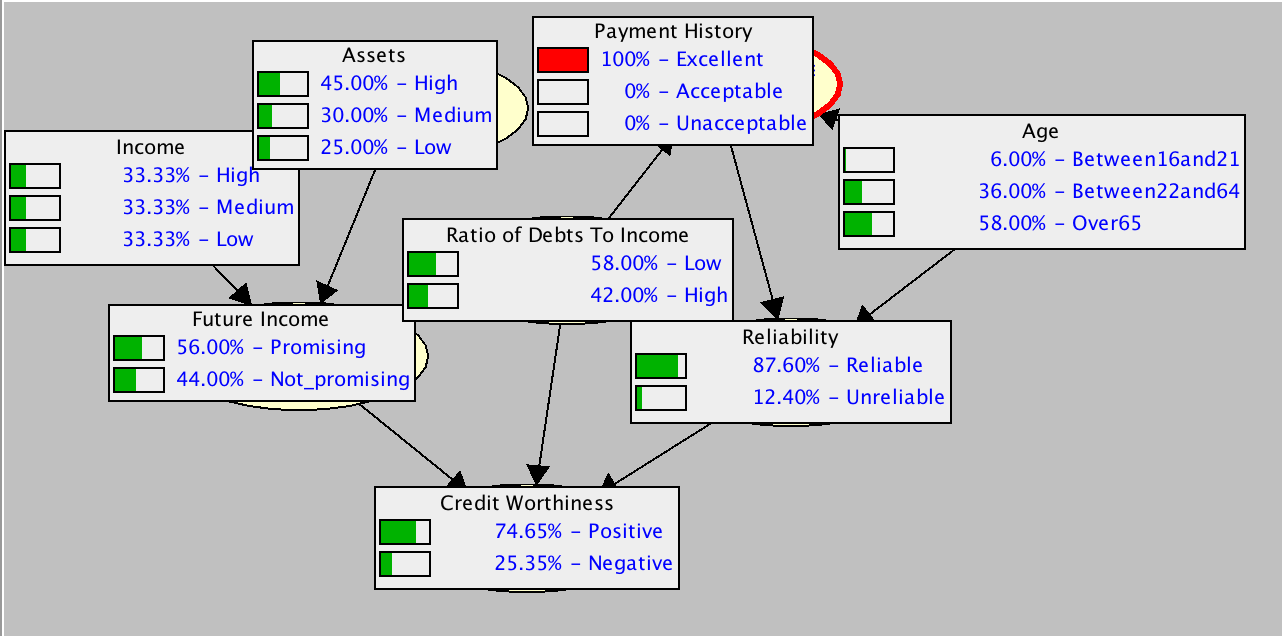
P( Credit-worthness = Positive | H = Unacceptable)= 39.91%.
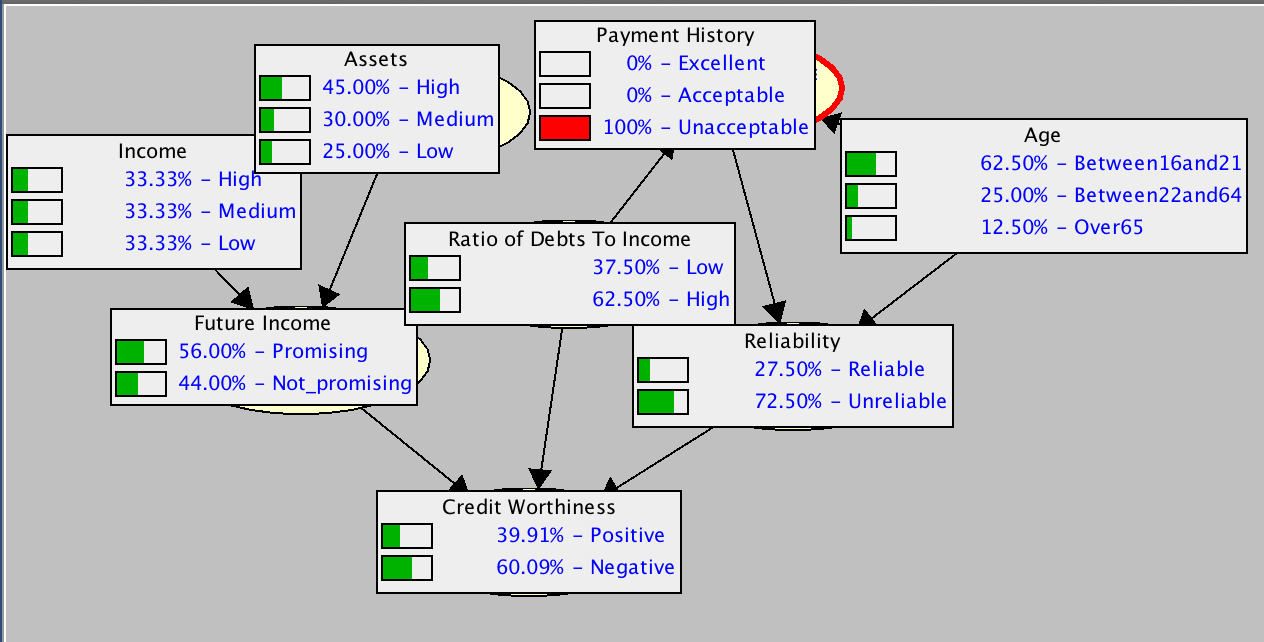
This result is consistent with our common sense.
3. Reference
“Probabilistic Graphical Models Principles and Techniques” by Daphne Koller and Nir Friedman